After downloading the German radar data set, preprocessing and applying a rain cell tracking to it, it is now finally time to have a look at the created rain event data set. Since the output of the rain cell tracking is quite elaborate, we will boil it down to a neat data base of the characteristics of rain events that I am interested in. We can then have a first look at some statistics. Follow me on this path.
This post is part of the germanRADARanalysis project.
The output files
First, we should make ourselves familiar with the available celltrack output files and which information they contain. Each directory contains a number of files. I did the rain cell tracking for each month separately. So below is the directory content for the month of March, 2001. I cropped the output to show only files that are relevant for us.
celltracking/
├── 2001
│   ├── 03
│   │   ├── cell_stats.txt
│   │   ├── tracks_all.txt
│   │   ├── meta_all.txt
│   │   ├── output_200103.txt
│   │   ├── ...
...Code language: Bash (bash)
Creating the event data base
Rain cells and event types
The first, most important file is cell_stats.txt. This file contains several characteristics for each identified rain cell, such as a unique cell ID, the average intensity, maximum intensity and the rain cell size.
The next file is tracks_all.txt. This file holds the IDs of cells that are connected in time by spatial overlaps (tracks). It is organized in sections, one for each track. As a reminder, a track is a sequence of rain cells that are uniquely connected in time. This means that a track has only one rain cell per time step. Consequently, a track does not merge or split.

The simplest, complete event type is a solitary track. This type of track does not involve slitting or merging at all. Check the example on the left. We see a solitary track if we remove the green framed cells.The other type of event, so called meta tracks involve splitting or merging. All cells included in the example on the left, make a meta track that contains three tracks. At time step (ts) 1, two cells merge and at ts 4 the cell splits into to different tracks.
You can imaging meta tracks as more complex rain events that include splitting and merging of rain cells between time steps. This brings us to the last file, meta_all.txt. This contains groups of tracks (meta tracks) that are connected via merging and splitting of rain cells.
The event characteristics
I want to extract a number of characteristics for each event, no matter if it is a solitary track or meta track. I will gather the following information about each track at its maximum intensity:
- the date and time
- the maximum intensity
- the rain cell size at this time step
- the coordinates of the intensity weighted center of mass
I will also select some general information about each event:
- the total duration
- the distance between the first and last rain cell
- the event type (solitary or meta track)
Constraints
From my previous research in the Space2rain project, I found out that including all rain tracks is not such a good idea. First we have many tracks that are only one time step long, so just a single cell. These events have very low intensities and are very small. Often just one grid point. To be selected, an event must have a minimum of three time steps: A beginning, middle part and ending.
Second, since we are using a radar data based precipitation product, we have to deal with clutter, most prominently ground echos in this case. This creates “pseudo rain events” in our data base that actually did not happen. Luckily, these pseudo events do not move much in space (ground echoes at buildings, mountains, etc) and can be simply filtered out. I do this by applying a minimum threshold to the distance between the first and last cell of a track. All events that travel less than five kilometers are removed from the data base.
Even by applying the described constraints, we end up with a total of more than 1.92 million rain events. The ratio of solitary to meta tracks is about 70%/30%.
Some basic track statistics
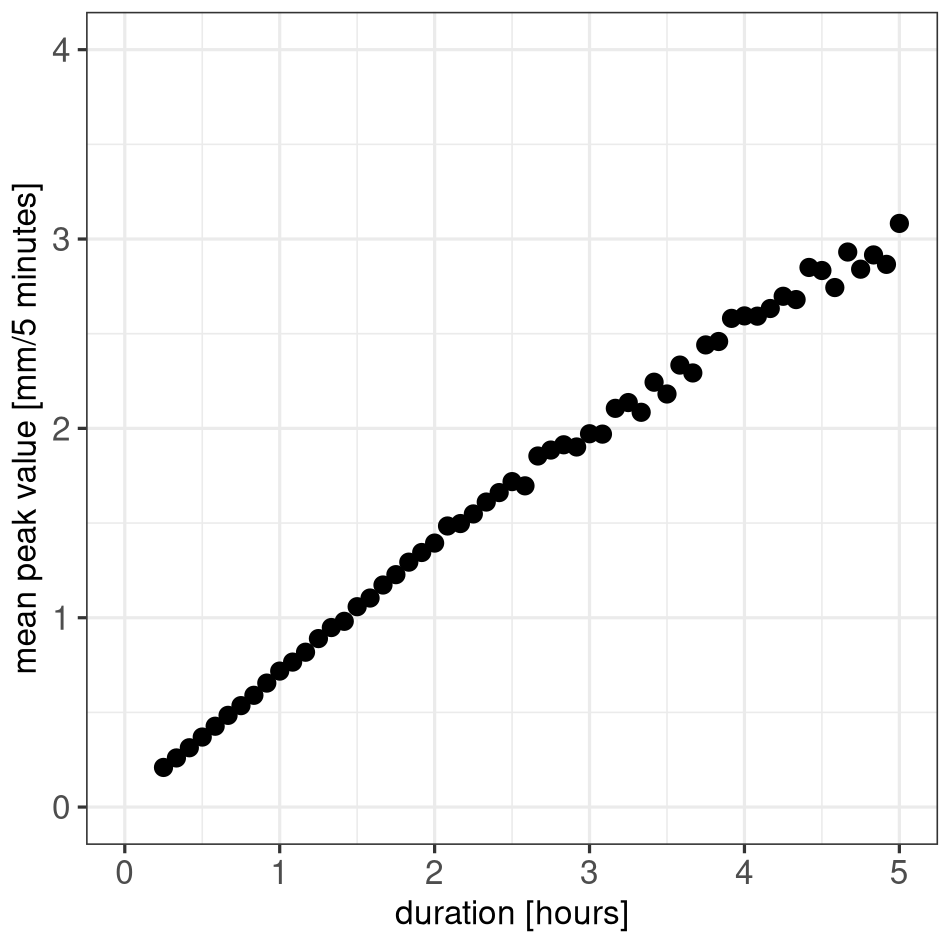
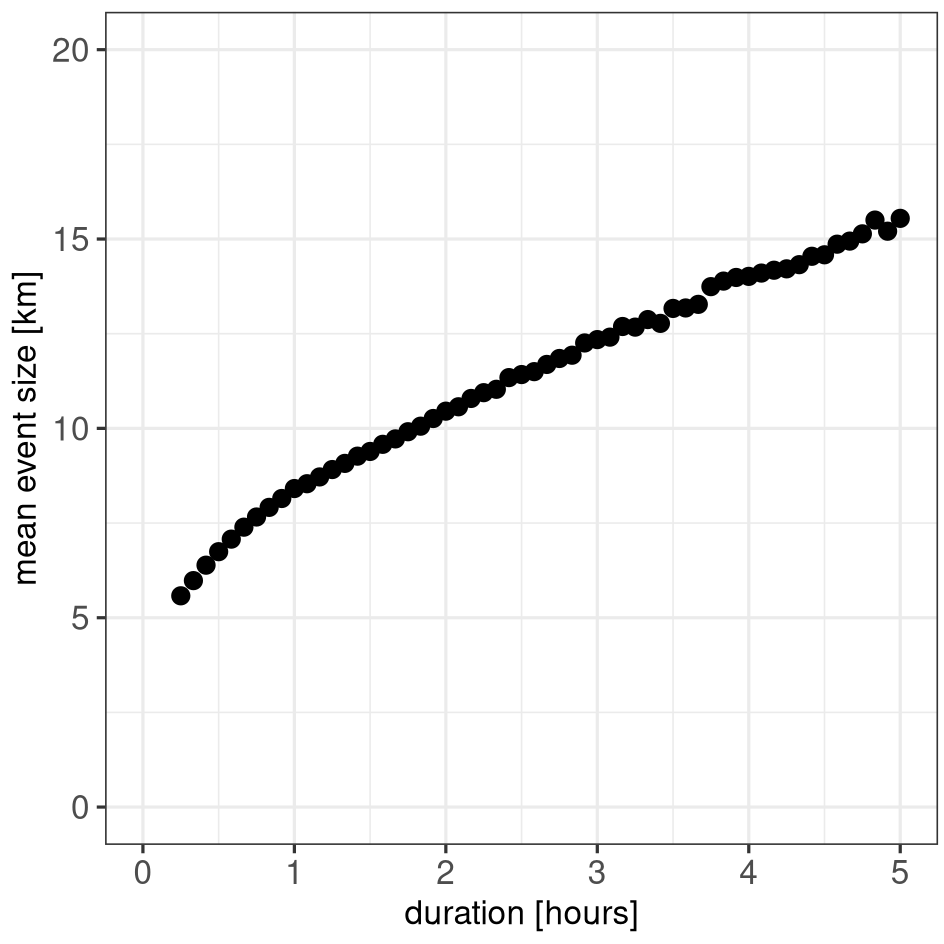
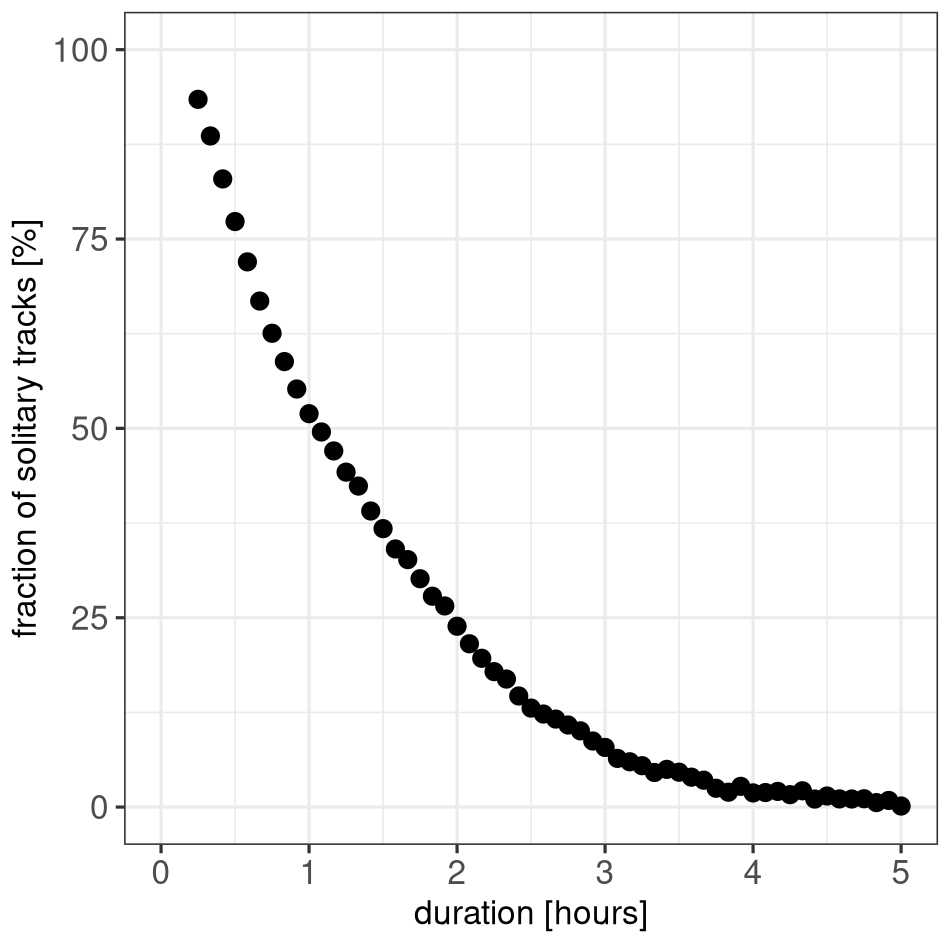
Below you see some basic statistics of event characteristics for tracks of different duration. Bottom line is, longer lasting events generally have a higher intensity and are larger in size. Also the probability of merging and splitting of rain cells increases, which means that the fraction of solitary tracks decreases with track duration.
The annual cycle of event intensity
We can also calculate a number of percentiles for each month throughout the year. The figures below shows this for the whole period of 20 years and for two consecutive time spans of ten years each.
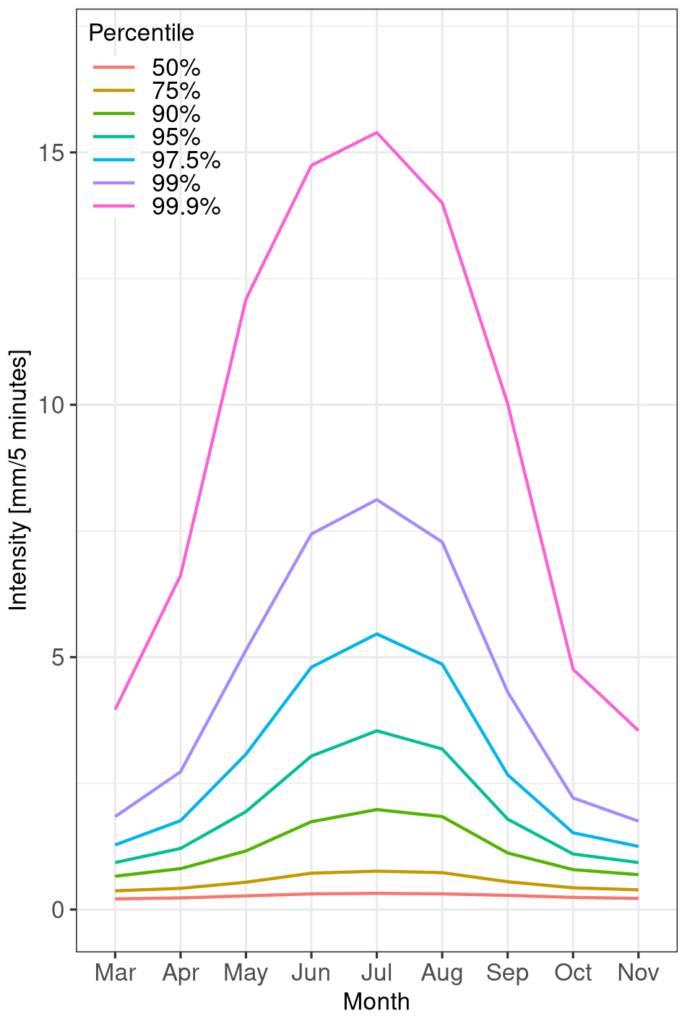
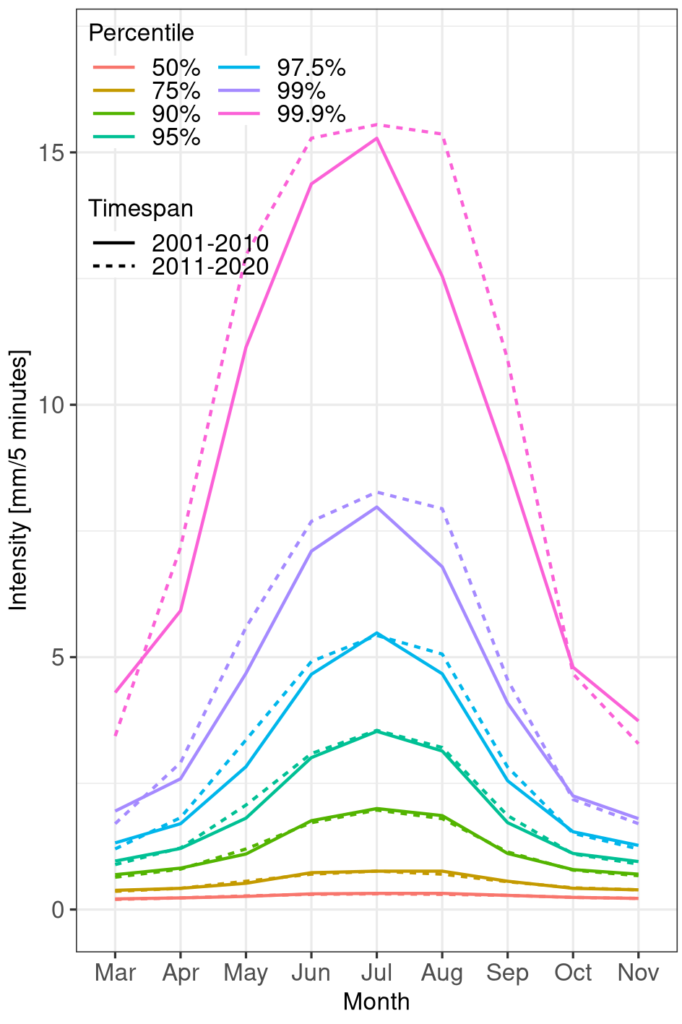
We can clearly see that the events with the highest intensities happen in the summer months June, July and August. Compared to the data from 2001 to 2010, events that occur between 2011 and 2020 generally have higher intensities in most months. Especially the most extreme events become more severe (99th and 99.9th percentiles).
The R code and the data set
The R scripts that I used for the extraction of event properties are simply too long to post them here. So I decided to make the event data base directly available. A zipped RData file with the full event data base can be downloaded from here.
Outlook
Now that I have a compact data base of rainfall events in Germany from 2001 to 2020, it is possible to do all sorts of statistics and other analysis. And since the data set spans 20 years of data, I will see if I can do a basic time series analysis to check if there are any trends in event characteristics.
I also plan to connect the detected events with meteorological data from weather stations to find out about dependencies of rain event properties on the local temperature and moisture availability.
I am also interested in the possibility to investigate the characteristics of different precipitation types – convective and stratiform. More on that in future posts, so stay tuned 😉
