In the last post, I showed how to extract information about rainfall events from the output of a rain cell tracking of 20 years of rain radar data in Germany. The event data base is free to download, by the way. We have also looked at some basic statistics already. Here, I want to go one step further and have a closer look at the characteristics of extreme rainfall events and how they change over the time period from 2001 to 2020. More specifically, I will investigate changes in the intensity and size of events. Let’s see what we can find out.
This post is part of the germanRADARanalysis project.
The approach
I will perform two types of analysis in this article. First, I want to get a robust estimate about general tendencies of extreme rainfall events over the whole period. Therefore, I split the event catalog into two samples. The first one contains all events from 2001 to 2010 and the second one all events from 2011 to 2020. I will then compare the intensity and size distributions of events between the decades.
In the second part, I will dive deeper and look at time series trends. This will be done with the method of linear regression. So I am checking if there are any continuous linear trends in event characteristics.
All analysis is done on a seasonal basis: spring, summer and autumn.
Frequency of events
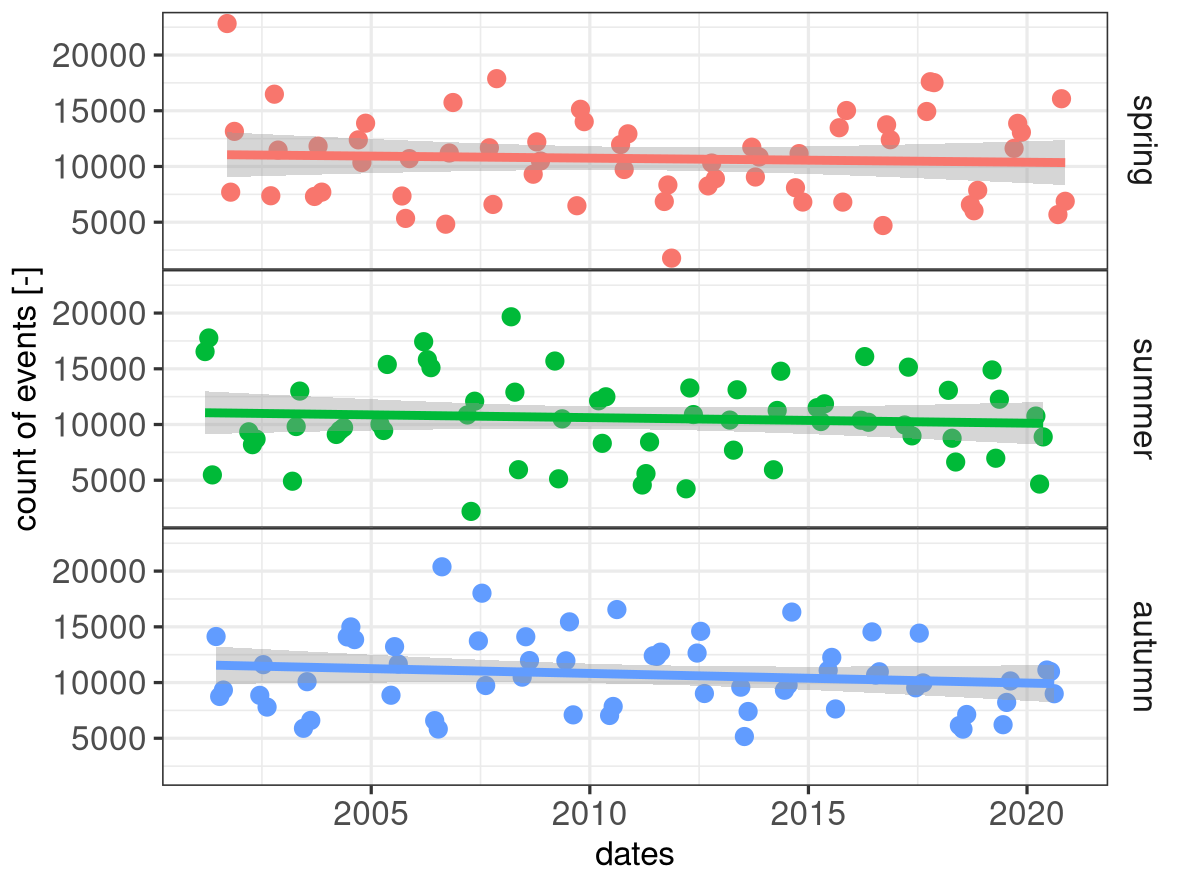
Before we can investigate trends in time series, we have to make sure that there are no significant changes in the frequency of events. Below, you see plots of the number of events per month in each time series.
We see that there are fluctuations from month to month over the years (points). However, the long term linear trends (solid lines) are not significant. It seems that in all seasons the number of events per month fluctuates roughly between 5,000 and 15,000 over the years.
A first glimpse at changes between decades
Now that we know that the number of events per month fluctuates over the years on a more or less constant level, we can start the distribution analysis for the two decades of data.
Intensity
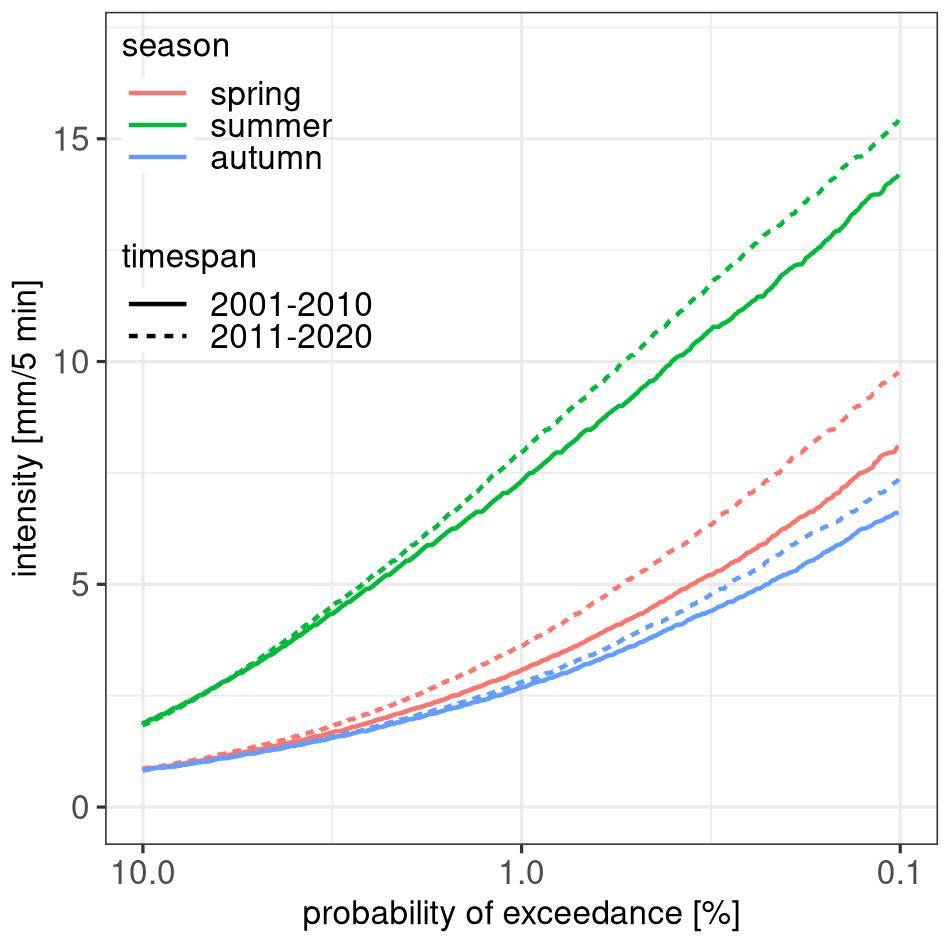
First, we look at the distribution of event peak intensity. The left graph below shows the so-called probability of exceedance. This statistic literally tells us the value which a certain percentage of events exceed. For instance, in summer from 2001 to 2010 1% of the events exceed an intensity of approximately 7.4 mm/5 min. In the later decade this value is higher. In summary, all seasons show an increase of the 10% most extreme events from the first to the second decade of this millennium.
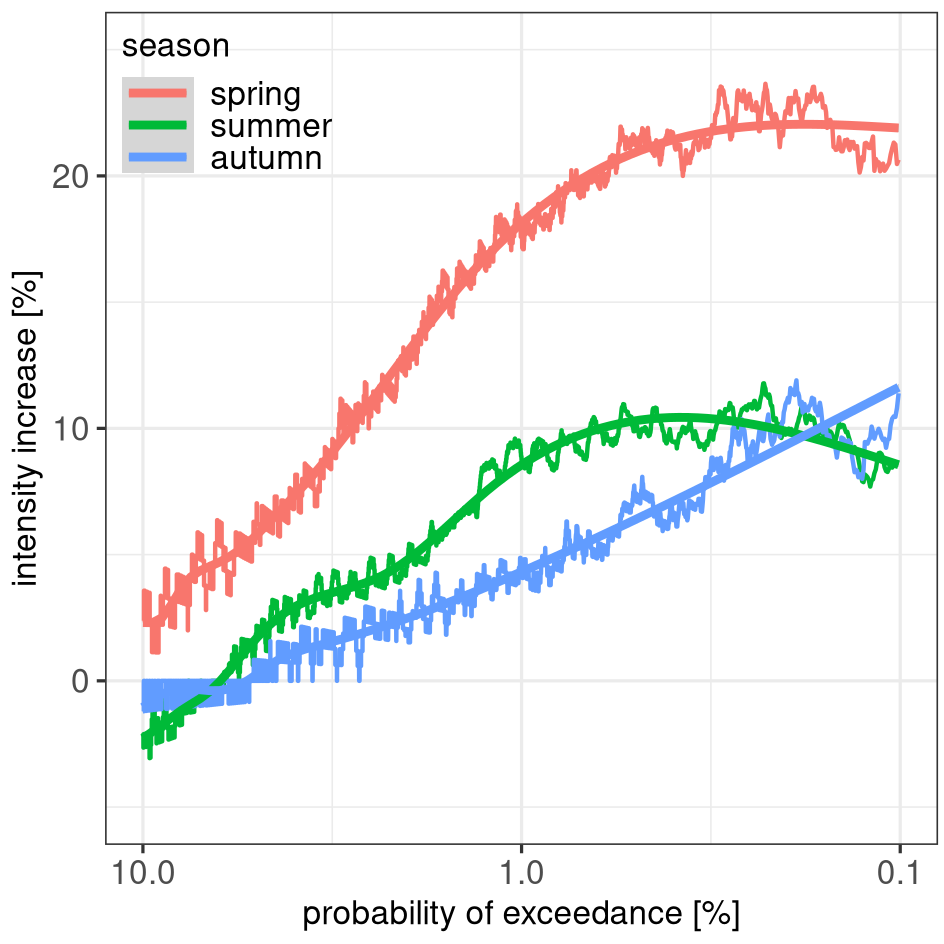
How much that is? We will find out when we look at the graph on the right side. This diagram shows the percentage increase between the two decades from the left plot. The strongest increase can be found for the top 1% of events. Especially in spring, the intensification of events reaches levels above 20%.
Event size
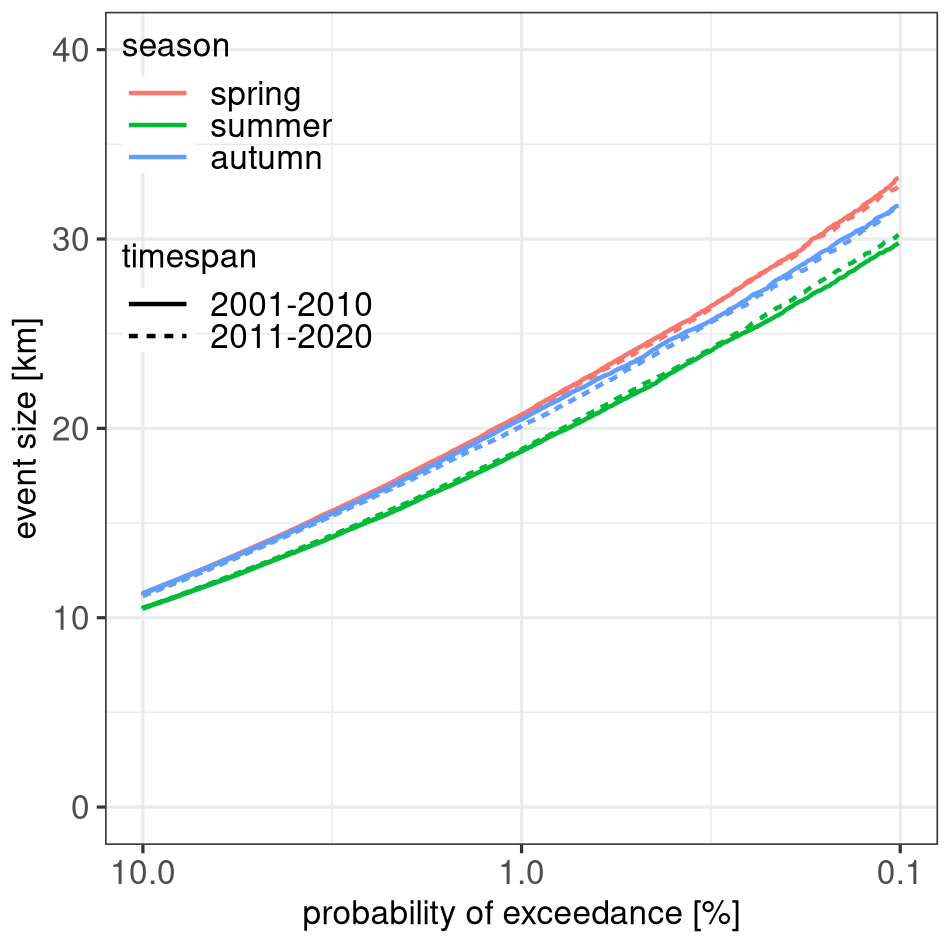
To figure out how event size changes between the two decades, we can repeat the analysis with this variable. The event size is defined as the square root of the area of the event.
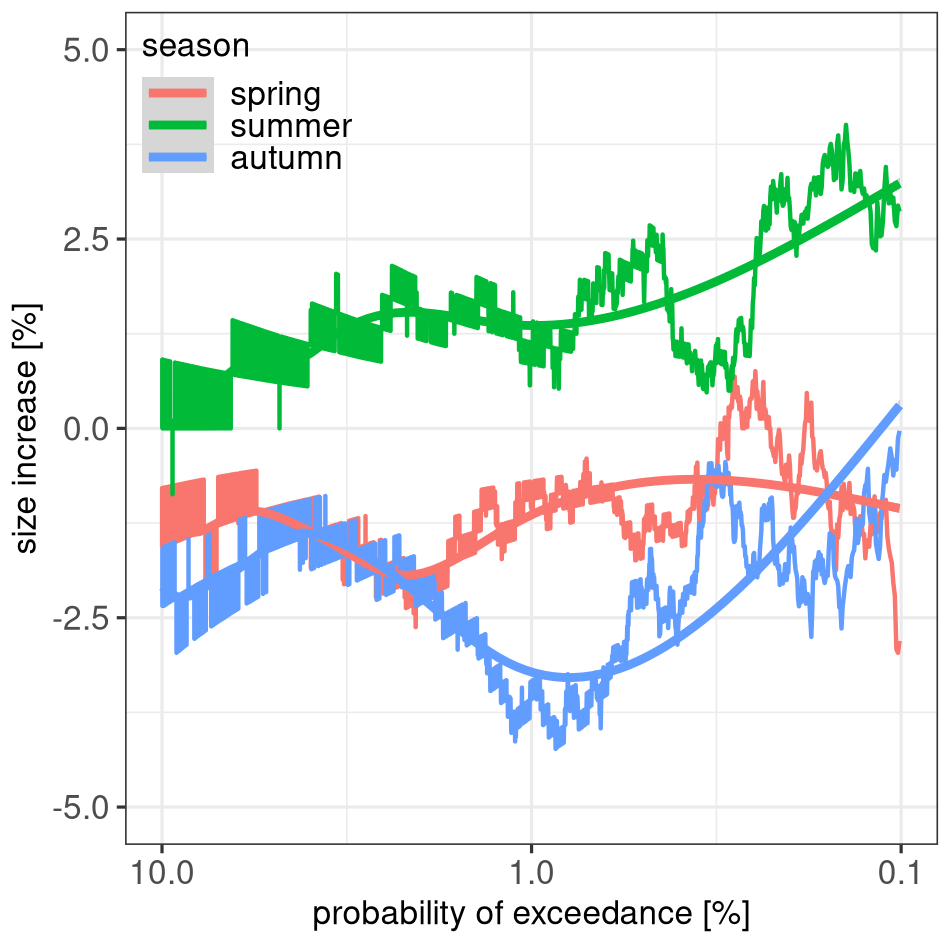
Here, the results are less uniform as with the intensity. While event size in spring and autumn rather decrease, we find a slight increase in the summer months.
Note that here we look at event size independently from intensity. This means, the events that are the top 1% largest are not necessarily the most intense. That’s something we will investigate in the next section.
The top 1% of events
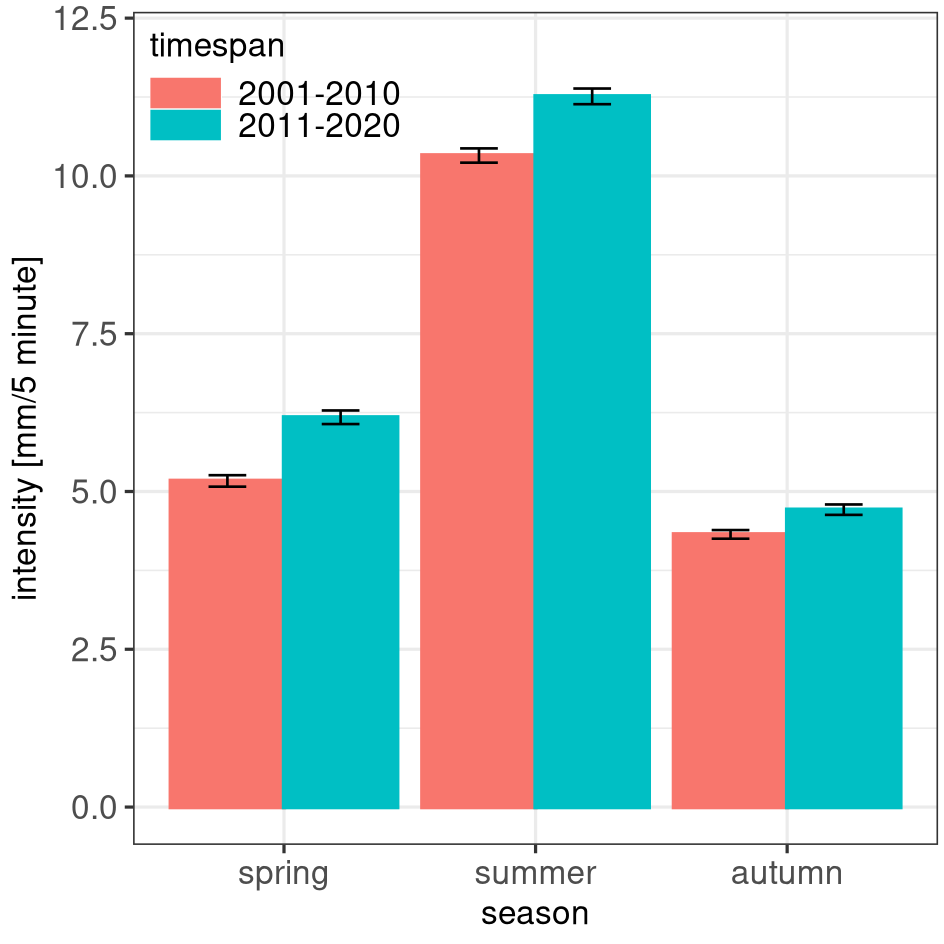
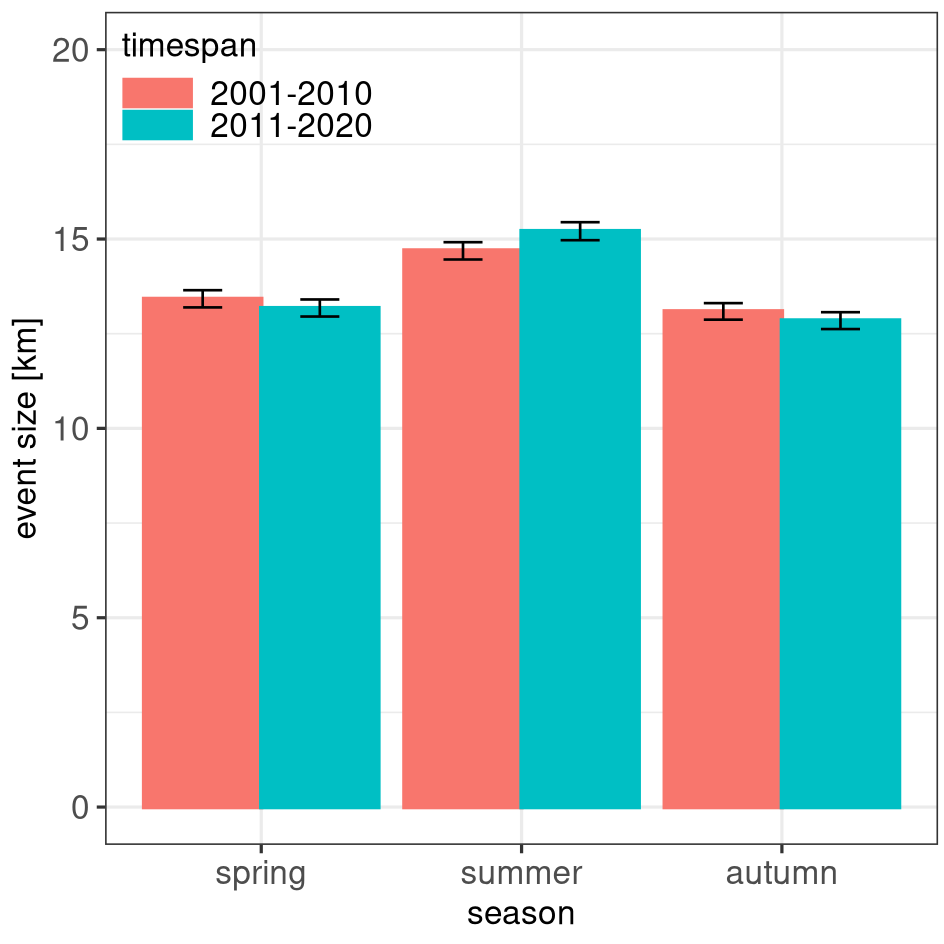
In the previous graphs, we saw that, especially for the intensity, the top 1% of events show the strongest response. So I will focus on them for the rest of the article. Also, I will define the top 1% of events as an intensity class. This means that I will look at the same sample of events when I calculate the event size. So for intensity, we look at the average intensity of the top 1% most extreme events. In the case of event size, we look at the average size of the exact same sample of events.
Below, you see bar graphs of event intensity and size (including 95% error bars). Just as in the previous plots, we see that the difference between the seasons is larger for intensity than for event size. And now we can also see that the differences in intensity between the decades is significant for all seasons, thanks to the error bars.
In case of the event size, it is still unclear. The general tendencies from the previous analysis hold. In summer, we find an increase from decade to decade, in spring and autumn, we see a decrease. The difference between the decades is only significant in summer.
Time series trends
In the last part of this post, I will investigate whether there are any continuous trends in intensity and event size of the top 1% most extreme events in each month. Therefore, I calculate the average peak intensity and size of the 1% most extreme events (defined by event peak intensity) for each month of the time series. I will then calculate linear trends (lm function in R). Confidence intervals are calculated with a level of 95% (confint function in R).
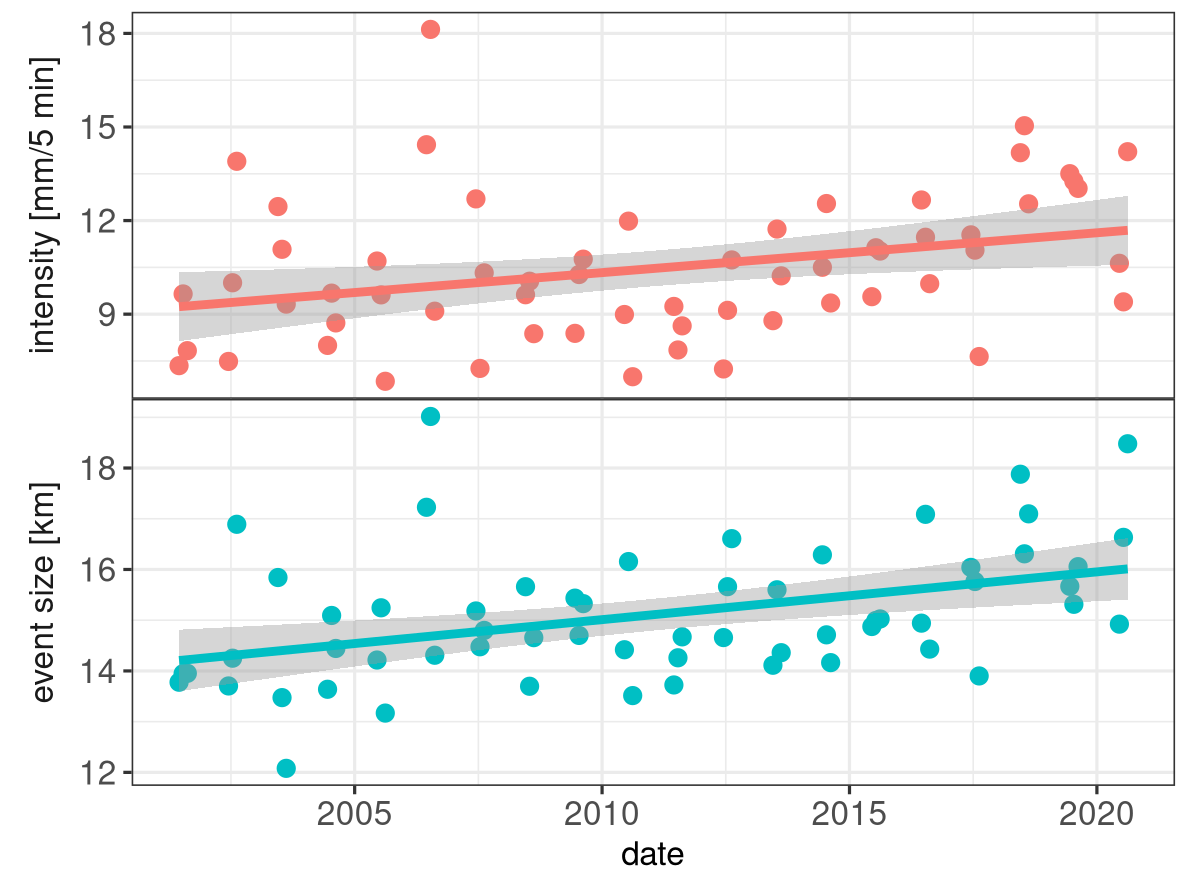
Above, you see the plotted monthly values for summer and the corresponding linear trends. Confidence intervals (95%) are indicated by the grey areas around the trend line.
According to the trend analysis, we can see that the intensity of the most extreme events in each month has increased from about 9 to almost 12 mm/5 min. The size of the same events increased from about 14 to 16 km.
More specifically, we found that intensity increased by 1.26 (±0.99) mm/5 min/decade and size by 0.94 (±0.55) km/decade, which is significant on a level of 95%. The table below lists all computed trends.
| Spring | Summer | Autumn | |
|---|---|---|---|
| Intensity | 0.21 (-0.99, 1.4) | 1.26 (0.28, 2.25) | -0.15 (-1.14, 0.84) |
| Event size | 0.26 (-0.34, 0.86) | 0.94 (0.39, 1.48) | 0.46 (-0.12, 1.05) |
However, intensity and size of extreme events in the other seasons do not show any significant continuous trends over the 20 years of available data.
Why are most linear trends not significant despite clear tendencies?
We have seen that most linear trends are not significant even though the comparison of the two decades showed significant increases of intensity in all seasons. Although, at this moment, I can only speculate about the reasons for this, I see two aspects that play a role here.
First, a trend in a time series comes from continuously increasing values. Fluctuations around this trend are due to internal variability, meaning that there are also other factors that influence the actual value than the factor(s) that cause the long term trend. Increasing the aggregation period from monthly to decadal time intervals, can smooth out the higher frequency fluctuations. See, for example, the figure below. It shows the same trend analysis as the previous figure but for the spring months (Mar. – May). But note that, in comparison with summer, the month-to-month variations are much higher. Values fluctuate by a factor of more than 4 in the most extreme cases. The signal compared to noise is much lower which makes it difficult to detect any trends with only 20 years of data.
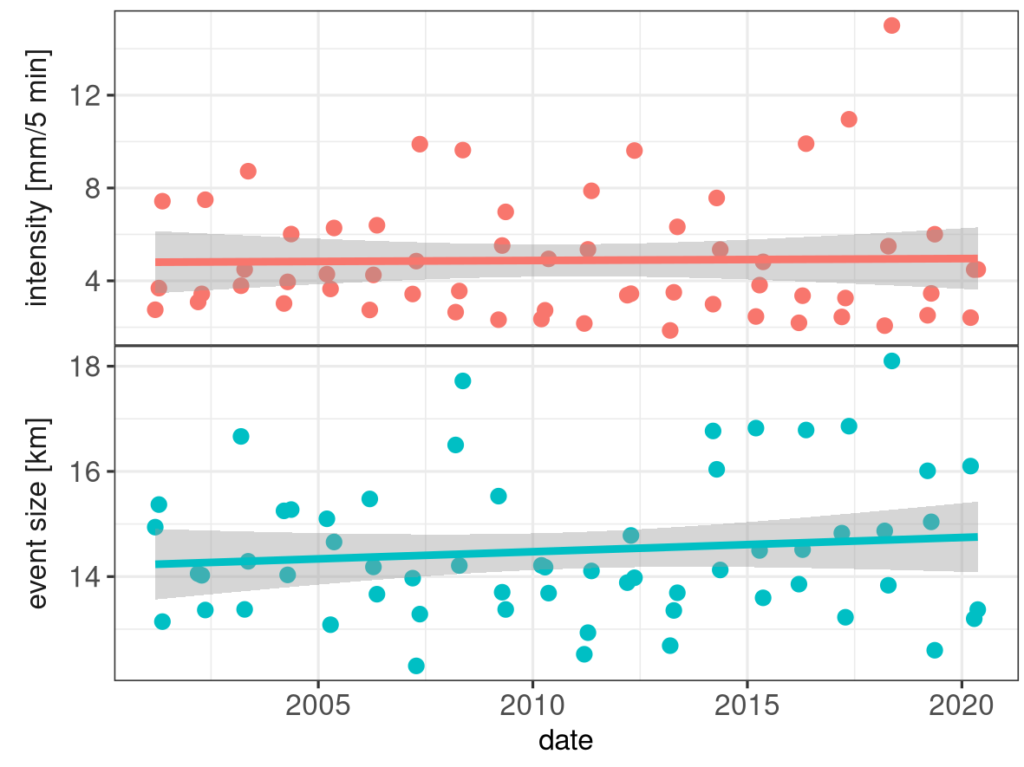
Second, it seems also that the distribution of event intensity in spring is more skewed toward lower values than in summer (which is not a good sign for linear trend analysis). That means that we see a higher density of points at low intensities than at higher values. This indicates that the increase between decades stems rather from an increase in the frequency of very intense events (and possibly their intensity) than from a continuous increase of event intensity. This frequency increase could possibly happen only in some months of the season or even just one.
Summary and outlook
In this article, I investigated whether there are long term changes in the intensity and size of extreme precipitation events in Germany. The event data base was created by a rain cell tracking applied to 20 years of 5 min rain radar data.
We found out that extreme precipitation events have a general tendency to become more intense in the two decades from 2001 to 2020. However, only events in summer show a significant continuous intensification over the years.
Event size is less univocal. For the summer months, event size continuously increases along with intensity. However, I do not find any significant changes in spring and autumn, neither in the decadal bulk statistics nor in linear trends.
In general, the transition seasons draw a more complex picture than summer. This could be due to the mixture of different precipitation types. It is known that extremes in summer are dominated by convective rainfall, whereas spring and autumn have a much higher frequency of low-intensity stratiform precipitation. So in a future post, I will have a closer look at the contributions of different precipitation types.
